A new series looking at premium structure, effective fleet risk management, and optimising claims handling processes, will give greater insight into ways to take greater control of fleet insurance costs.
In this, the first of three articles, Karl Jones of industry insurance specialist OAMPS, will explore some effective strategies for reducing fleet insurance costs and gaining a competitive advantage in the marketplace.
The government-backed Highways England program, Driving for Better Business, has analysed businesses to help reduce work-related road risks and costs as well as improve compliance.
The figures revealed that implementing a road risk management program can bring substantial financial benefits.
A road risk management program results in reductions of:
26% in fleet insurance premiums
54% in insurance claims
22-87% in incident volume
84% in third party claims
40% in accident rates
10% in fuel use
23-82% in repair costs
30% in maintenance costs
20% in fault claims
78% in damage costs
Your premium structure
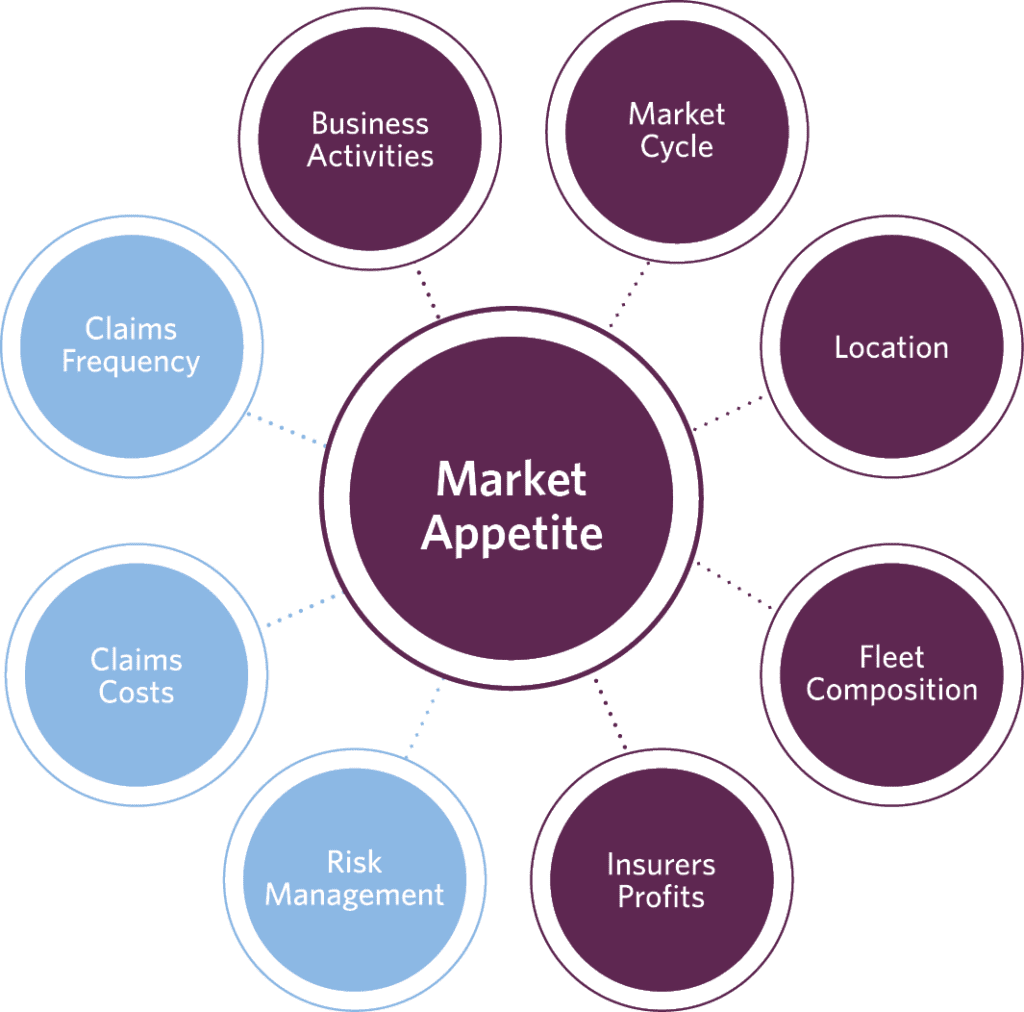
Many factors that influence the premium you pay for fleet insurance. Some of these are out of your direct control, but there are three areas where you can exert some influence.
The claims your drivers generate, and the costs arising from these claims, form the baseline for the underwriter’s premiums, but there is some potential variability as to how underwriters assess the headlines – are lower claims costs split over a higher number of claims better or worse than higher claims cost split over a small number of high value losses?
Manage risks associated with your fleet
How you manage the risks associated with your fleet is also a significant factor that often dictates how underwriters view your business – have you been lucky/unlucky, or do your results reflect the standard of fleet risk management you operate at?
Ultimately, the premium you pay is directly linked to how much competition is there for your fleet insurance from the insurance market. Your ability to influence that market appetite is connected to your claims costs, claims frequency and how you manage your fleet risks.
Premium composition
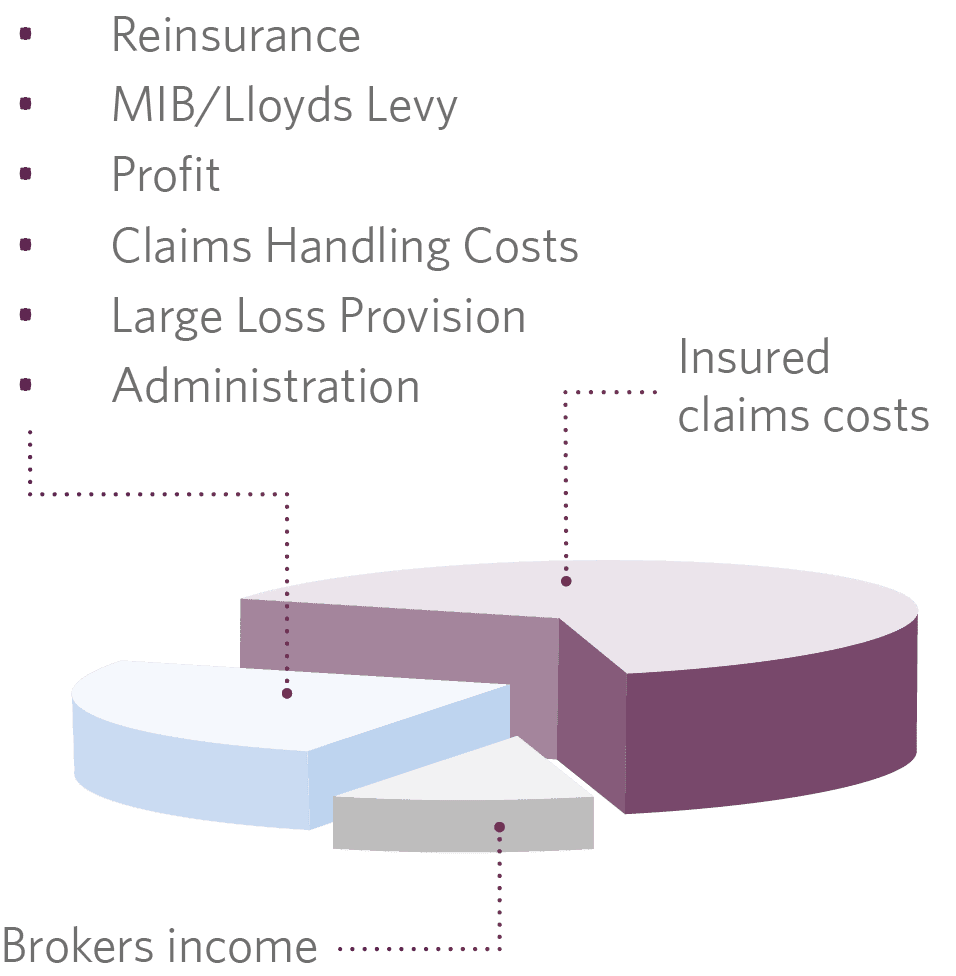
Insured claims costs (the figures on the Confirmed Claims Experience issued by your insurers) account for between 40% – 60% of the baseline premium, depending on the market cycle, and can offer the biggest return on investment as well as being the area over which you have most influence.
• £100,000 insured claims costs = premiums between £167,000 – £250,000 depending on market cycle
• £80,000 insured claims costs = premiums between £133,000 – £200,000 depending on market cycle
So, a £20,000 reduction in insured claims costs could equate to a £50,000 premium reduction – food for thought?
Insured claims costs
Insured claims costs are a simple total:
Number of Claims x Cost per Claim = Insured Claims Costs
Average cost per claim (note 2 at base)
2019 2020 2021 £4,502 £5,037 £5,349
Hidden claims costs
By definition, hidden claims costs are slightly more difficult to quantify, but that doesn’t make them any less significant or damaging to your organisation and, when you actually add up the totals involved, it’s easy to see why focusing on managing claims can have a dramatic impact on your bottom line.
The International Loss Control Institute says that for every £1 an insurer pays out, the uninsured costs to the business can be more than £83.
Even if the hidden cost was ‘only’ treble the insured claims cost, it’s still a significant amount that you have to find through extra sales or cost reductions.
Minimising fleet insurance costs
The approach to impacting the total claims cost is split between reducing the number of claims your drivers are involved in whilst also reducing the costs of each claim.
In the next article from OAMPS Hazardous Industries, specialist industry provider of services to support and protect sector businesses, we will look at how to minimise the likelihood of your vehicles being involved in claims.
The sole purpose of this article is to provide guidance on the issues covered. This article is not intended to give legal advice, and, accordingly, it should not be relied upon. It should not be regarded as a comprehensive statement of the law and/or market practice in this area. We make no claims as to the completeness or accuracy of the information contained herein or in the links which were live at the date of publication. You should not act upon (or should refrain from acting upon) information in this publication without first seeking specific legal and/or specialist advice. Pen Underwriting Limited and OAMPS, part of Pen Underwriting Limited, accepts no liability for any inaccuracy, omission or mistake in this publication, nor will we be responsible for any loss which may be suffered as a result of any person relying on the information contained herein. OAMPS is part of Pen Underwriting Limited which is authorised and regulated by the Financial Conduct Authority (FCA number 314493). Registered Office: The Walbrook Building, 25 Walbrook, London EC4N 8AW. Registered in England and Wales. Company Number: 5172311.
1 Driving For Better Business, https://www.drivingforbetterbusiness.com/wp-content/uploads/2018/04/DfBB-Risk-Guide-2018.pdf 2 WTW (2022) UK motor claims inflation on the rise with added pressure from delayed injury settlements, UK motor claims inflation on the rise with added pressure from delayed injury settlements – WTW (wtwco.com) 3 Fleet News, https://www.fleetnews.co.uk/fleet-management/risk-management/what-is-the-true-cost-of-a-collision-experts-explain