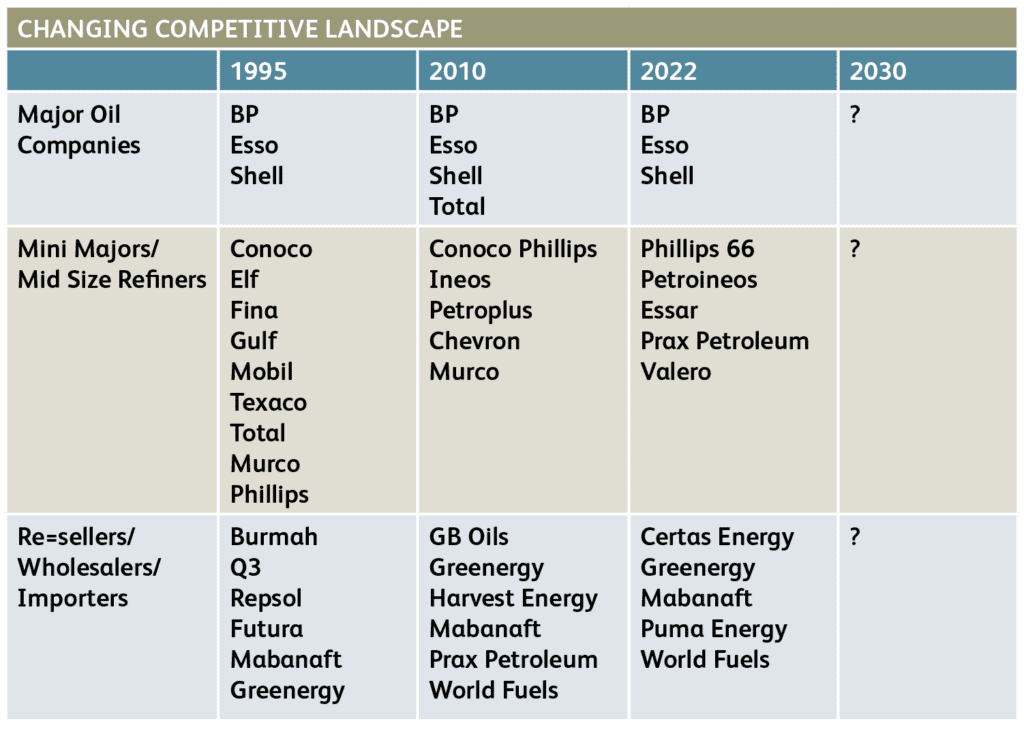
This was a harbinger of a process which has accelerated sharply in the current millennium, resulting in a 2022 landscape which is significantly different compared to that of the mid-1990s, as can be seen in the table below.

The landscape of the mid – late 20th century was dominated by a number of integrated refiners / marketers who viewed the inland market as an important, secure outlet for refinery production. The core channels for this production were those which required investment in physical assets i.e., retail filling stations and aviation ‘wingtip’ operations.
Products, predominantly middle distillates, were also sold to wholesalers / resellers, commercial and industrial companies and public authorities, with these sales playing a key role in optimising refinery products balances.
For several of these players, especially BP, Shell, Texaco and Total, value chain integration, from refinery gate through to end customer, was actively pursued via ownership of retail sites and equity distributors. This was seen as a way of both securing a share of refinery output and underpinning the marketing margin.
The current millennium saw a general reversal of this policy, with large scale divestments of owned filling stations and equity distributors; in the case of the former, these were sold with 5-year products supply agreements and accompanying brand licences. The emphasis now switched to being wholesalers of products i.e., B2B suppliers which, in turn, created opportunities for the emergence and growth of a number of importers / wholesalers.
We will now look at some of the significant trends that have characterised the 21st century landscape.
Significant 21st century developments:
Four particular trends are worth highlighting:
• The three majors, BP, Esso and Shell, have lost ground from their former dominant position of nationwide representation in the second half of the 20th century, when they supplied circa 55-60% of the inland market. In the aviation fuel sector, however, they continue to dominate at the country’s two main airports; Heathrow and Gatwick. These companies have extensive worldwide representation, supplying at many of the major airports, with Shell being the global market leader.
• The refinery network has diminished in size from 9 facilities in 1995 to 6 now.
• The middle tier of the landscape (mid-size integrated refiners / marketers) has seen several changes in the identity of, as well as reduction in, the number of participants; from nine 25 years ago to a current five, as a result of withdrawals, take-overs and consolidation.
• As already noted, the market position of the wholesalers / importers has grown substantially from around a 7% share at the start of the millennium to between 35-40% now – and even higher in ground transport fuels (over 40%), with two particularly large players:
– Greenergy, which started in 1992, is now market leader, with national distribution coverage and a particularly strong position in the supply of products to supermarkets, especially Tesco & Sainsbury. Greenergy is majority (85%) owned by Canadian infrastructure fund, Brookfield Business Partners.
– Certas Energy is a wholly owned subsidiary of Dublin based FTSE100 company, DCC, which entered the UK market in 2001 by buying BP equity distributor, Scottish Oils, and then, over the ensuing 15 years, embarked on an ambitious distributor acquisition programme, which included the equity distributor businesses of Shell (Shell Direct), Texaco and Total (TotalButler).
Principal market channels:
We will now take a brief look at developments and prospects in the three main channels to market, which are:
• Retail
• Commercial / Industrial / Wholesale fuels
• Aviation fuels
Retail
At the start of the millennium there were just over 13,000 filling stations, which declined to just under 9,000 over the ensuing 10 years and to 8,490 by the end of 2015, since when the network numbers have remained stable – standing at 8,378 at the end of 2021.
The five leading suppliers are Tesco (circa 16% share), BP (15%), Shell (14%), Esso (12%) and Sainsbury (10%).
Recent notable developments are:
– The dominance of the supermarkets, whose market share has more than doubled in the current millennium to around 45%, a level at which it is showing signs of stabilising in the past few years – The emergence of large dealer groups (those with 100+ outlets), initially prompted by the site divestment programmes of some of the larger integrated oil companies. These groups now comprise around a quarter of the total site network and account for just under a quarter of total forecourt fuel volumes.
– Earnings from non-fuel activities now generally comprise the lion’s share of forecourt totals, with around 90% of sites having a shop, of which convenience stores are the dominant format – accounting for about a third of the overall shop estate and circa 60% of total forecourt shop turnover – with Spar being the largest ‘symbol group’.
– The dramatic fall in the popularity of diesel cars, which comprised just over 50% of new car sales at peak, in 2016, to a 2021 level of around 14%- and now into single digits.
Current EV charging points (Zap-Map, September 2022) amount to 34,860, at 20,888 locations and, while the charge point numbers have doubled in the past three years, the challenge ahead is formidable if the government’s target of having 300,000 charging points in place by 2030 is to be achieved!

Within the existing forecourt sector, it seems that BP, Shell and the largest independent dealer group, MFG (900+ sites), are in the vanguard of EV charging roll-out. In 2018 BP acquired the UK’s largest EV charging company, Chargemaster, while, in 2017, Shell acquired Dutch company, New Motion, one of Europe’s largest electric vehicle charging companies. MFG plans to invest circa £400 million to install around 3,000 ultra-rapid chargers (150 kW and 350 kW) across 500 of its sites by the end of 2030.
What will be the size and shape of the forecourt network in 2030, when sales of new ICE cars are due to be banned?
The over-arching determinant will be the pace of the energy transition and the accompanying rate of EV adoption; recent estimates suggest that around 20% of the total fleet will be EVs, which are also projected to represent about a third of used car sales. Given the growth and importance of non-fuel earnings, a major conundrum will be how these are impacted by declining fuel demand i.e. extent of correlation; experience during covid-19 lockdowns provides cause for encouragement.
At site level, two considerations, in particular, will weigh on the decision to install EV chargers:
- local grid capacity
- forecourt size / space available.
Commercial / industrial / wholesale fuels
Traditionally, these sales were viewed primarily as outlets for the disposal of middle distillates in order to optimise refinery balances. However, as the UK has moved increasingly into a deficit position in these grades – with net imports of diesel accounting for around half of inland demand and that for Jet A-1 around two thirds – this has ceased to be the main drive’, with the loss of Russian material introducing a new dynamic.
As with the retail sector, the rate of attrition of sales of hydrocarbon fuels for ground transport will be determined by the rate of adoption of sustainable, low carbon energy sources.
Sales of fossil fuels for space heating (commercial and residential) are expected to be increasingly phased out from the mid-2020s.
With the above factors determining the size of the market come 2030, it remains to be seen how many of the existing players can be accommodated – or will be prepared to continue participating in this sector – and how many may pursue new or different earnings opportunities.

Aviation fuel
The current millennium has seen three new entrants to the UK aviation fuel sector – Mabanaft, World Fuels and the world’s largest oil trading group, Vitol. Demand is not expected to recover to pre-covid levels until around 2024, and, as a result, further changes to the competitive landscape seem improbable in the near future.
It is commonly recognised that this sector will be the most difficult to decarbonise, especially long haul (flights over 6 hours), which accounts for around 60% of global fuel usage. Increasingly, both at EU and member country levels, mandates are in place to promote adoption of sustainable aviation fuel (SAF).
The UK net zero strategy for aviation, published in July, commits UK domestic aviation to achieving net zero emissions by 2040, and for all airports in England to be zero emission by the same year. To create secure and growing SAF uptake there will be mandate requiring at least 10% (c.1.2 million tonnes) of jet fuel to be made from sustainable sources by 2030, with increasing proportions of SAF being blended from 2025. There is also a commitment to have at least 5 commercial scale SAF production plants under construction by 2025.
These are substantial challenges for the sector, given that SAF uptake currently represents circa 0.1% of jet fuel demand, and, as such, has the potential to drive further changes in the competitive landscape, with the entry of specialised SAF suppliers.
A lot of change is in the offing, which will influence the size and shape of the competitive downstream landscape in ways that are, as yet, unclear. Will there be further consolidation? What about new players?
One thing that is abundantly clear, however, is that those who prosper best will be the ones who most successfully adapt to and navigate the energy transition by positioning themselves to take best advantage of the opportunities it offers; this will likely include pursuit and development of entirely new or different revenue streams.
ROD PROWSE, worked for 30 years across the full spectrum of the downstream oil sector, in both the UK and USA, which has included leadership positions in both retail and wholesale fuels businesses. Rod draws on his extensive knowledge of this global industry to bring us ‘Industry Insights’.
