
Smaller deliveries can mean higher costs per litre – but could better planning, telemetry and automatic top-ups change the equation?
Last month, Delivering Insight followed the litre from the terminal to the depot, asking whether ex-rack collection or delivered-in supply offers the better business model. This month, we follow that litre on the next stage of its journey – from depot to customer.
Every delivery a fuel oil distributor makes incurs many of the same underlying costs, whether the customer takes 400 litres or 1,400. Driver time, vehicle costs, administration, route planning and depot overheads do not fall proportionately with the volume delivered. As a result, the size of each drop can have a significant impact on the true cost per litre – and ultimately on the margin that remains.
That matters particularly if customer buying behaviour is moving towards smaller, more frequent orders.
In this month’s Delivering Insight, we look at the economics of delivery size, how FODs can calculate the point at which smaller drops become commercially unattractive, and whether minimum orders, differentiated pricing, automatic top-ups, telemetry and better route planning can help protect profitability.
1. Why does drop size matter?
As discussed in our previous Delivering Insights article: Ex-Rack Terminal Collection or Delivered-In Supply: Finding the Right Model, many of the costs associated with putting a tanker on the road are incurred regardless of the volume being transported.
Most of the delivery cost is incurred on a per-visit basis rather than a per-litre basis.
Fixed costs include:
- Driver time/wages
- Vehicle costs and depreciation.
- Insurance
- Administration: Order processing; invoicing; customer communication; compliance requirements are relatively unaffected by delivery size.
- Route planning: Delivery scheduling and route optimisation.
- Depot overheads: Staffing, premises, IT systems and operating overheads are spread across all deliveries.
Variable/semi-variable costs include:
- Fuel consumption / cost varies with mileage, vehicle type, route and delivery activity.
- Overtime.
- Vehicle maintenance/repairs.
What about driver productivity?
Delivery time is a fixed cost that does not increase proportionally with the volume delivered.
The delivery process – travel, siting the vehicle, safety checks, setup and paperwork – is also largely independent of volume.
As a result, a larger volume can be delivered without a proportionate increase in total delivery time, making more efficient use of driver and vehicle time.
Conversely, smaller drops may reduce the number of deliveries possible within a working day, potentially resulting in increased left-behind volumes or extended driver hours.
It is therefore important to consider not only the cost per delivery, but also how drop size affects driver productivity, vehicle utilisation and the number of deliveries that can be completed each day.
A cost analysis should therefore focus on costs that can be reasonably attributed to each delivery, while recognising that actual costs will vary by FOD, fleet, route and operating model.
2. What does a delivery actually cost?
There are four elements to consider in calculating your delivery costs.
i. What does getting the tanker to the customer actually cost?
This is calculated by adding your total fixed operating costs to an estimate of your total variable costs and dividing by the total number of drops.
ii. What is the cost per litre delivered?
Divide the delivery cost by the volume ordered to establish your cost per litre for any drop.
iii. What is the contribution?
Calculate the gross margin for the number of litres delivered and subtract the delivery cost.
iv. What is the contribution per driver hour?
This gets interesting when you start to compare multiple small drops with fewer larger ones. A small drop may generate a positive contribution, but it could still be a poor use of driver / tanker capacity.
Let’s use an illustrative example to consider how this works in practice:
Assume the attributable cost of making a delivery is £40.
Then:
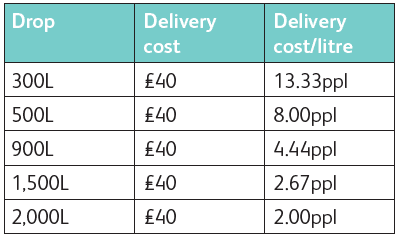
Replace the arbitrary £40 with your own attributable delivery cost and the calculation becomes specific to your business.
Is it a profitable drop?
Illustrative example: Suppose, again purely illustratively, that at the price sold you have 8ppl available to cover delivery cost and contribution.
For a 900l drop:
900 litres × 8ppl = £72 available contribution
£72 – £40 attributable delivery cost = £32 remaining contribution
However, let’s look at how that changes with delivery volume:
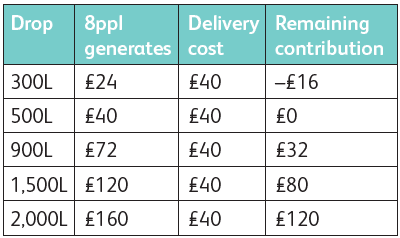
Business Question:
What is the minimum economically viable drop for your business at your normal margin?
Increased cost to serve – the impact of smaller deliveries
The effect compounds. Smaller drops not only increase delivery cost per litre; if average drop size falls, more delivery events are required to move the same annual volume. That can increase driver hours, vehicle utilisation, administration and route-planning activity – while reducing contribution per delivery.
Business impacts
Here’s another illustrative example you can apply to your business:
For a business that delivers 4.5 million litres per annum.
At an average 900l drop = 5,000 deliveries.
At an average 500l drop = 9,000 deliveries.
That’s 4,000 additional deliveries to move exactly the same amount of fuel. That’s potentially £160,000 of additional delivery activity, assuming our arbitrary cost of £40 per delivery.
While the cost increase is not a linear one, the reduced drop size would require the business to accommodate 80% more deliveries to move exactly the same volume.
Changing customer behaviour
What is creating this pressure to reduce drop volumes and how can it be mitigated?
Our previous Delivering Insight article “Are Fuel Buying Patterns Changing in the UK and Ireland Domestic Heating Sectors?” addressed this question.
It considered evidence that domestic heating customers are moving from larger seasonal orders towards smaller, more frequent ‘top-up’ deliveries. Historically, a 500l minimum order volume was a common industry approach. Now, increasing numbers of customers are searching for smaller delivery volumes.
These changing buying patterns are driven by:
Price and cash flow pressures
- Online price comparison
- Climate changes
- Shifting seasonal demand patterns
- Automatic ordering
- Telemetry / automated replenishment
Changing customer behaviour is impacting business cost. But is a smaller delivery always a worse delivery?
Top-up services – good or bad for profitability?
At face value, automatic top-up services may appear challenging for FODs because they can involve smaller average drop sizes and more frequent deliveries.
In reality, the profitability of an automated top-up model depends not only on the litres delivered per visit, but on how efficiently those deliveries can be planned and completed.
Benefits
- More predictable delivery schedules and improved demand visibility.
- Reduced risk of emergency deliveries and last-minute call-outs.
- Better route planning and improved fleet utilisation.
- Increased customer retention through a more convenient and reliable service.
Route optimisation
There are various providers of sector-specific route optimisation software that can improve the efficiency of top-up deliveries.
- Smaller average drops increase the importance of route density and efficient scheduling.
- Planned top-up deliveries can be grouped geographically, reducing empty mileage and improving vehicle utilisation.
- Practicalities will depend on customer location and access requirements, with some sites requiring smaller vehicles or alternative delivery approaches.
Telemetry
A range of specialist telemetry providers supply remote tank monitoring hardware and software to domestic and commercial fuel distributors. These solutions can:
- Help FODs assess whether a top-up model can be operated profitably.
- Support top-up services by providing visibility of customer fuel levels and enabling proactive delivery scheduling.
- Allows FODs to move from reactive to planned deliveries.
The combination of telemetry and route optimisation can help offset some of the additional delivery activity associated with smaller average drops.
Back to our question: Is a smaller delivery always bad for profitability?
The answer is more nuanced than it would first appear.
A spontaneous 400L order 15 miles away might be commercially poor. A planned 400L telemetry-triggered drop to a customer on a route where the tanker is already passing might be perfectly attractive.
So, the real equation isn’t simply: bigger drop = better.
It’s closer to: drop size + route density + predictability + delivery frequency + customer lifetime value = commercial viability.
Summary
What have we learned?
Bigger drops usually cost less per litre to deliver, because many delivery costs arise per visit rather than per litre.
There is no universal minimum profitable drop. It depends on your delivery cost, margin, route and customer.
Smaller doesn’t automatically mean unprofitable. Predictable, geographically clustered drops can be more attractive than larger reactive deliveries. Know your number. Every FOD should understand the minimum economically viable delivery under its own operating model.
Remember:
- Reducing minimum order quantities may help meet changing customer expectations but can increase the cost of servicing each customer.
- It is essential to balance customer flexibility with the impact on delivery frequency, fleet utilisation and contribution.
Review your delivery economics
1. Calculate
Establish:
- Your average domestic drop size
- Average deliveries per customer per year
- Attributable cost per delivery
- Delivery cost per litre
- Average gross margin/contribution per litre
- Average time per delivery
- Deliveries per driver day
- Litres delivered per driver day
- Frequency of emergency deliveries
Then calculate the contribution generated by different delivery sizes using your own figures.
2. Compare
Model the effect of different drop sizes.
What happens to cost per litre at 300L, 500L, 900L, 1,500L and 2,000L?
What happens to the number of delivery events required to move the same annual volume?
Which customers consistently order below your economically preferred drop size?
Then compare manual ordering with planned or automatic top-up customers. Does greater predictability allow smaller deliveries to be incorporated into existing routes more efficiently?
3. Decide
If smaller drops remain commercially viable:
Customer flexibility may be worth retaining, particularly where deliveries can be efficiently incorporated into existing routes.
If smaller drops significantly reduce contribution:
Consider whether minimum order quantities, small-load premiums or delivery charges are appropriate.
If top-up customers generate smaller but more predictable drops:
Assess the whole customer relationship rather than individual delivery size alone. Improved route planning, retention and fewer emergency deliveries may compensate for a lower average drop.
If your minimum viable drop is higher than customers increasingly want to buy:
Review whether the answer is minimum order quantities, differentiated pricing, greater delivery efficiency — or a combination of all three.
The business question
Do we know the smallest delivery we can make profitably – or are our minimum order quantities simply what we’ve always offered?
With geography impacting delivery economics, the next stage is to understand what distance and customer location add to the cost.
Delivering Insight is your monthly business‑critical briefing. Designed to give SME distributors clear, actionable guidance to work smarter and more profitably. Although larger distribution groups may have in-house HR teams, fleet managers, compliance officers and analysts, many SME FODs operate without those resources.
Delivering Insight is your virtual support team – a growing knowledge base that builds into a valuable reference library for your business, helping you make informed decisions that safeguard your business today and strengthen it for the future.
NEXT MONTH
We will be delivering insights on route economics: what impact do remote customers have on your cost of delivery – and should they pay more?
Image credit: